Accelerate LC-MS/MS Method Development Using Restek's Free Pro EZLC Chromatogram Modeler
![]()
Comparing Lab-Based and Pro EZLC Method Development
Setting analytical goals is the initial step in developing an LC-MS/MS technique, whether it is done in the lab or with a chromatogram simulator. Each lab and procedure will have different requirements for sensitivity, runtime, and resolution. For one application, for instance, chromatographic resolution of critical pairings may be crucial, even at the sacrifice of speed. However, for a different application, a shorter run time can be necessary to achieve the desired sample throughput. Before starting the method development process, labs must review and appraise their own demands for each application.
The creation of an instrument-based LC-MS/MS method often takes time to optimize the chromatographic settings, mass spectrometer settings, and sample preparation techniques (Figure 1). Method development with the Pro EZLC chromatogram modeller requires just minutes of simulation to complete the same task as days of lab effort spent refining the chromatographic separation, identifying precursor and product ions, and choosing the appropriate mode for each molecule. Pro EZLC models are based on reliable algorithms and experimental data produced by Restek's scientists, thus no experimental input is required. Through the use of method simulation, the chromatographic method may be swiftly refined, freeing up time for additional method development processes like refining the MS parameters or the sample preparation steps. Because of the time savings, routine sample analysis and technique validation can begin sooner.
Figure 1: LC-MS/MS method development requires optimization of chromatographic conditions, mass spectrometer settings, and sample preparation procedures. Using the Pro EZLC modeller to simulate different conditions, the chromatographic method can be optimized in minutes without any time-consuming lab work.

Once analytical goals for resolution, speed, and sensitivity have been set, method developers may spend days to weeks in the lab testing and establishing optimal conditions. When doing so, they are limited by the availability of instruments, columns, and other materials. In contrast, with a chromatogram simulator, analysts can explore the effects of parameter changes without preparing solutions, installing columns, and waiting for analytical results. You can even test columns you do not have before you buy them to assess different chemistries and dimensions and determine if they will work for your specific set of analytes. While sensitivity assessments, sample preparation, MS optimization, and matrix effects evaluation must still be done in the lab, Figure 2 illustrates the relative speed, savings, and simplicity of using free Pro EZLC software to develop the chromatographic portion of new methods.
Figure 2: Simulated method development with the Pro EZLC chromatogram modeller is faster and simpler than lab-based approaches.

Does It Work? Let’s Try It Out!
While using a chromatogram simulator is faster than lab-based method development, that benefit is only realized if the modeller accurately predicts actual results. To test this, we will walk through the Pro EZLC software to develop methods for drugs of abuse and then compare the modeled results to lab-generated results.
Select Analytes & Phase on the Compounds Tab
The Pro EZLC chromatogram modeller is organized into three tabbed sections: Compounds, Conditions, and My EZLC. Work begins in the Compounds tab, and Figure 3 identifies the input fields that we will use to create a model. Our first step is to select a Compound Class (3A) and then click on individual compounds (3B) to build a list of target analytes. This can be done by scrolling through the list or entering a compound name (or CAS number) in the search box (3C). A Help file (3D) is also available within the tool, and it provides more detailed instructions on how to perform specific tasks.
Figure 3: The Pro EZLC chromatogram modeller Compounds tab (circled in red) interface and input fields: (3A) compound class pick list; (3B) compound list; (3C) search box; (3D) help file; (3E) isobars alert; (3F) stationary phase pick list; (3G) generate model button; (3H) model view area.

For this demonstration, we have selected the following 15 drugs of abuse because they cover a wide span of the chromatographic space (from early to late eluting) and include isobars and other challenging separations.
- Codeine
- N-Desmethyltapentadol
- O-Desmethyl-cis-tramadol
- Desomorphine
- Dextromethorphan
- Dihydrocodeine
- Methamphetamine
- Morphine
- Morphine-N-oxide
- Norcodeine
- Normorphine
- Noroxycodone
- Oxymorphone
- Pentazocine
- Phentermine
This list contains four groups of isobaric compounds that share the same molecular weight: desomorphine/ dextromethorphan/normorphine (m/z 272); dihydrocodeine/morphine-N-oxide/noroxycodone/oxymorphone (m/z 302); morphine/norcodeine/pentazocine (m/z 286); and methamphetamine/phentermine (m/z 150). The Pro EZLC chromatogram modeller conveniently identifies such compounds as Isobars to Resolve (3E) and automatically alerts us with a white check in a blue box. Since the modeller preselects isobaric compounds for resolution, users do not need to worry about overlooking isobars during method development, and they can simply scan the list and deselect compounds if desired. Isobar resolution is an area where it is particularly important to optimize for one’s own goals for resolution versus speed because if certain compounds are less important, or if they can be distinguished by different fragmentation ions, then deselecting them for resolution can speed up analysis time considerably. (Note that deselecting isobars for resolution by removing the white checkmark in the blue box for each specific compound is different from deselecting compounds for inclusion in the model. A compound’s inclusion in the model is indicated by the compound’s whole row being blue.)
The final step on the Compound tab is to select the Stationary Phase (3F) that you want to evaluate. The pick list of phases is limited to those on which Restek’s scientists have already collected and validated compound libraries; this protects users from selecting columns that are not well suited for particular target analytes. For our list of compounds, we will choose the Biphenyl stationary phase because it can separate a wider range of compound chemistries than is possible on a C18. The Biphenyl phase has heightened aromatic selectivity compared to a C18, and it separates many difficult analytes, often including isobars. In addition, the Biphenyl’s stronger retention protects early eluting compounds from matrix-related ionization suppression. Once the phase has been selected, click the Generate Model button (3G), and the modeled result will appear in the model view area (3H). Note that once the model is generated some additional prompts will appear at the bottom of the Compounds tab. You can request help with your model from Technical Service directly from here, and you can also report any analytes that you wanted to include in your model but that were not on the list. Missing compounds will not be available immediately, but they will be considered for addition to future versions of the modeller.
Evaluate the Initial Model
The initial modeled separation produced by the Pro EZLC software for our compound list is shown in Figure 4. The only modification we made to the automatically generated conditions was to change the dwell volume from the default value (0.25 mL) to 0.38 mL. Dwell volume is discussed later in this article when we explore optimization, but this initial change was made to match the dwell volume of the specific instrument that we will use in the lab to assess the model’s accuracy. After evaluating the initial model and testing it in the lab, we will further optimize it.
Figure 4: The initial model generated by the Pro EZLC chromatogram modeller (4A). This model can be used directly in the lab or refined further by the user through the Conditions tab (circled in red) interface and input fields: (4A) initial model view (scroll down through a live model for peak list and compound details); (4B) Optimize Gradient Slope button; (4C) user input fields; (4D) isobar selector; and (4E) results field.

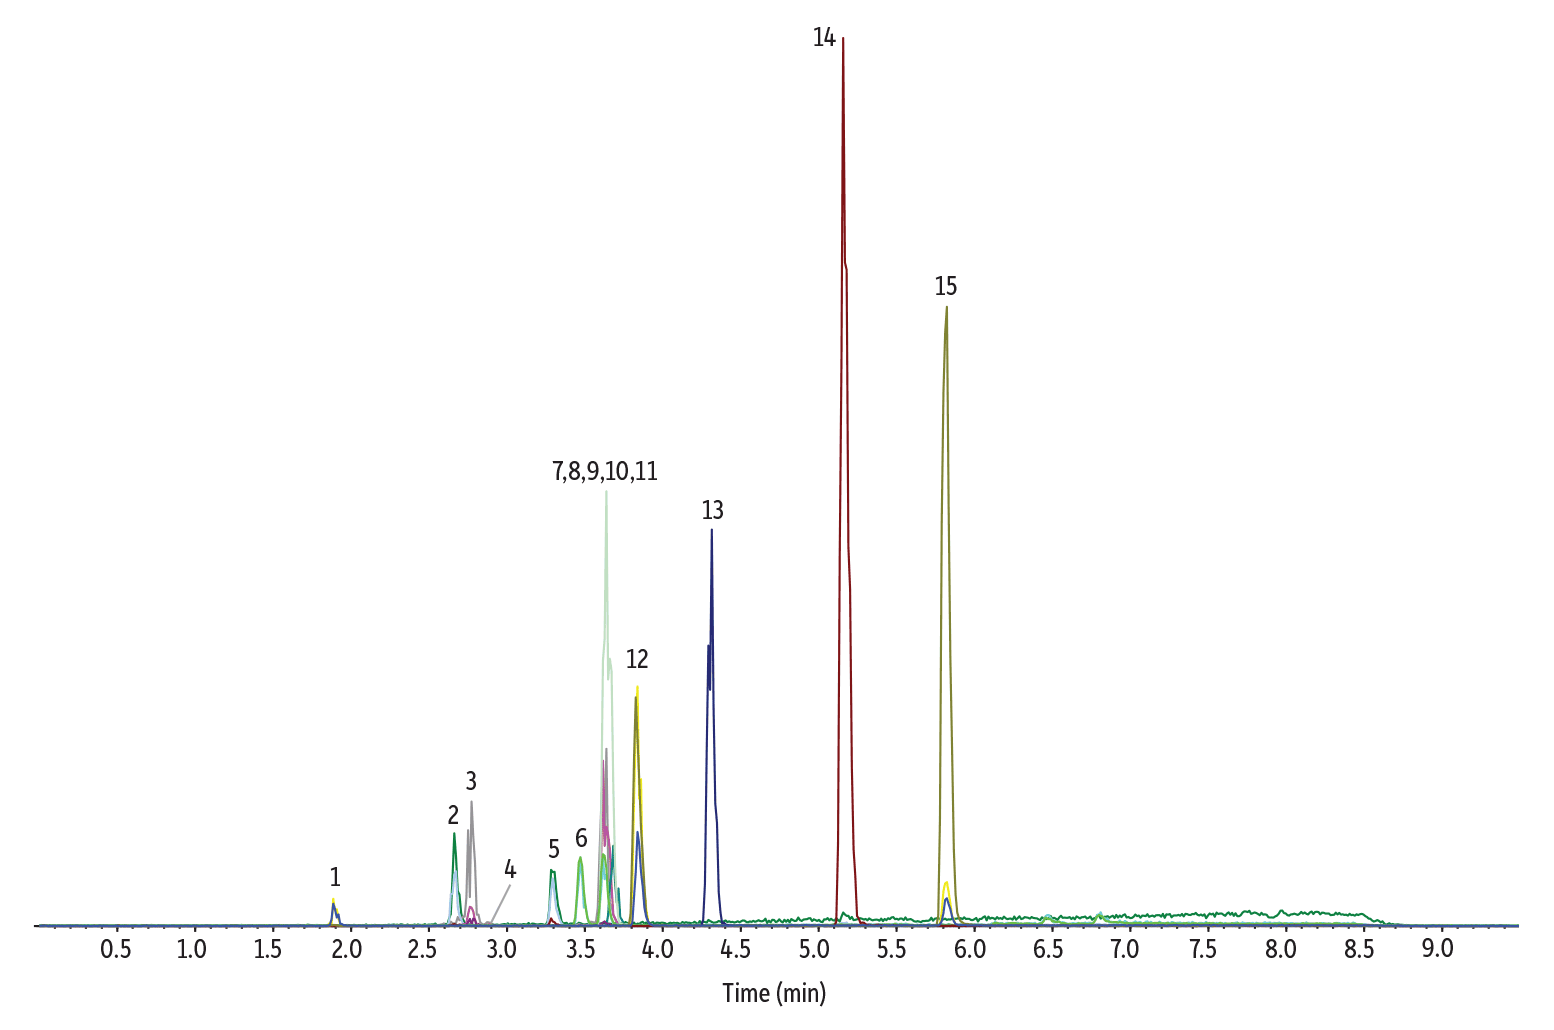
Looking in greater detail at the specific results for our initial model (Figure 5), we see the chromatogram simulator generated a 7.4-minute analytical run time using a simple gradient that separates most compounds. The peak list table below the model provides additional information for all compounds, including retention time, resolution, peak width, elution %B, ionization mode, and commonly monitored ions.
In our initial model, two groups of coelutions are predicted: methamphetamine/phentermine and dihydrocodeine/noroxycodone/O-desmethyl-cis-tramadol/codeine. Using the peak list information, we see that the compounds in the first group (methamphetamine/phentermine) share both precursor and product ions, so chromatographic resolution is essential for accuracy if they need to be reported independently. However, in the second group, all four compounds have different fragmentation product ions so they can still be distinguished by the MS even though they coelute. To better visualize the degree of coelution for isobaric compounds, users can select an isobaric ion from the Available Isobars list (Figure 6).
In addition to compound information, the chromatogram modeller provides a helpful warning that these conditions may exceed the pressure limit of a standard HPLC instrument. The void time (T0) is also displayed, so we can minimize matrix effects by considering if there is adequate distance between T0 and early eluting compounds.
Figure 5: Initial Pro EZLC modeled separation of 15 drugs of abuse on a Restek Biphenyl column.

Figure 6: Chromatographic separation of isobaric compounds can be highlighted visually. Isobars that are not separated to your resolution specification (which can be set on the Conditions tab) are shown in red or orange depending on the degree of coelution; isobars that are properly resolved are shown in green.

Having reviewed the initial modeled results, we next went to the lab to test how well Pro EZLC software predicted real-life separations. Figure 7 shows the results of an in-lab injection on an LC-MS/MS run under the exact modeled conditions. Note that a re-equilibration step was added to the in-lab test because it is necessary to return the instrument to the set conditions before the next injection. Comparing the modeled and empirical results, all compounds eluted in the same order and at similar retention times. In-lab and modeled coelution patterns were also similar, but the predicted methamphetamine/phentermine coelution was actually separated in the lab on the Raptor Biphenyl column. Because the Pro EZLC chromatogram modeller is conservative and designed to underpredict resolution, modeled coelutions are sometimes separated during analysis on an instrument.
Figure 7: Lab-generated chromatographic separations closely match the initial Pro EZLC model, but the predicted methamphetamine/phentermine coelution was actually separated in the lab.
| Peaks | tR (min) | Precursor Ion | Product Ion | |
|---|---|---|---|---|
| 1. | Normorphine | 1.89 | 272.3 | 165.2 |
| 2. | Morphine | 2.66 | 286.2 | 152.1 |
| 3. | Oxymorphone | 2.77 | 302.1 | 227.2 |
| 4. | Morphine-N-oxide | 2.88 | 302.3 | 285.2 |
| 5. | Norcodeine | 3.29 | 286.1 | 151.9 |
| 6. | Methamphetamine | 3.47 | 150.3 | 91.1 |
| 7. | Phentermine | 3.62 | 150.3 | 91.1 |
| Peaks | tR (min) | Precursor Ion | Product Ion | |
|---|---|---|---|---|
| 8. | Dihydrocodeine | 3.62 | 302.2 | 199.0 |
| 9. | Noroxycodone | 3.62 | 302.1 | 227.0 |
| 10. | O-Desmethyl-cis-tramadol | 3.64 | 250.2 | 58.0 |
| 11. | Codeine | 3.68 | 300.2 | 152.0 |
| 12. | Desomorphine | 3.84 | 272.1 | 152.1 |
| 13. | N-Desmethyltapentadol | 4.31 | 208.1 | 121.2 |
| 14. | Pentazocine | 5.16 | 286.2 | 218.1 |
| 15. | Dextromethorphan | 5.82 | 272.2 | 215.1 |
| Column | Raptor Biphenyl (cat.# 9309A12) | ||||||||||||||||||||
|---|---|---|---|---|---|---|---|---|---|---|---|---|---|---|---|---|---|---|---|---|---|
| Dimensions: | 100 mm x 2.1 mm ID | ||||||||||||||||||||
| Particle Size: | 2.7 µm | ||||||||||||||||||||
| Pore Size: | 90 Å | ||||||||||||||||||||
| Temp.: | 30 °C | ||||||||||||||||||||
| Standard/Sample | |||||||||||||||||||||
| Diluent: | Water | ||||||||||||||||||||
| Conc.: | 100 ng/mL | ||||||||||||||||||||
| Inj. Vol.: | 1 µL | ||||||||||||||||||||
| Mobile Phase | |||||||||||||||||||||
| A: | Water, 0.1% formic acid | ||||||||||||||||||||
| B: | Methanol, 0.1% formic acid | ||||||||||||||||||||
|
| Detector | MS/MS |
|---|---|
| Ion Source: | Electrospray |
| Ion Mode: | ESI+ |
| Mode: | MRM |
| Instrument | API LC-MS/MS |
Optimize Models on the Conditions Tab
As demonstrated above, the initial model generated by the Pro EZLC software can be implemented directly in the lab with excellent results. However, further optimization, if desired, can also done using the Conditions tab interface shown in Figure 4. In our next example, we will optimize the initial model to reduce the analysis time.
The fastest way to refine a method is by clicking the Optimize Gradient Slope button (4B), which can be done iteratively if further improvements to resolution and speed are possible through gradient changes under the current conditions. Alternatively, analysts can optimize methods with greater control by modifying conditions through the user input fields (4C), which allow users to change column dimensions, system volumes (volume effects area), organic mobile phase, column temperature, the gradient program, and resolution requirements. For our example, we will use these fields to manually change parameters and instantly see the effect in both the model view and the Results field (4E).
When optimizing, carefully consider your specific analytical goals as well as the following information about the variables in each user input section. As you optimize, pay close attention to the how the changes you make affect the modeled results. With the Pro EZLC chromatogram modeller, you can review results in real time instead of spending days in the lab only to discover that column selectivity is not adequate or that the pressure exceeds your instrument’s limit.
-
Column
When selecting column dimensions, choosing a shorter, narrower column can result in solvent savings, faster runtimes, and higher sample throughput (as long as resolution requirements are still met). Alternatively, if more resolution is required, a longer column may be needed, though this may increase runtime. Note that all possible column formats are not shown because the choices presented by the Pro EZLC chromatogram modeller only include those that have been demonstrated to provide good results for the target analytes. The modeller results are only verified on Restek columns and may not transfer to columns from other manufacturers because variables such as silica specifications, bonding strategies, and packing protocols impact column performance.
-
Volume Effects
Dwell Volume and Extra-Column Volume are instrument-specific values that can affect retention time and peak width, respectively. The chromatogram modeller uses conservative default values in these fields but changing them to your instrument’s exact values will help generate models that are more accurate to the instrument that will be used for analysis. To find these volumes, consult your instrument documentation or contact the instrument manufacturer. For more information on how these volumes affect modeled results and how to determine them on modified instruments, click the Help button on the Pro EZLC interface.
-
Mobile Phase
When selecting the organic solvent for a mobile phase, the relative eutropic strength of the solvent should be considered because it can affect both retention and selectivity. Acetonitrile (an aprotic solvent) has a higher elution strength than methanol (a protic solvent), so all else being equal, analytes will elute earlier using acetonitrile. If more retention is needed, especially to keep early eluting compounds from eluting in the void volume or being affected by early eluting matrix components, methanol may be a better choice. If less retention is needed, increasing the amount of methanol or switching to acetonitrile could be considered. In addition to overall retention being affected by solvent choice, shifts in relative retention (selectivity) and even elution order, can also be seen as compounds with different characteristics (e.g., acidic compounds vs. their neutral counterparts) responded differently. Note that as is the case with the column choices presented by the chromatogram modeller, the mobile phase choices are only those that have been tested by Restek chemists and determined to perform well for the target analytes.
In addition to selecting which organic solvent to use in the mobile phase, this section of the chromatogram modeller allows users to modify the column temperature (up to a maximum of 60 °C). When doing so, note that temperature increases can decrease back pressure due to reductions in viscosity. When selecting column temperature, always be aware of the temperature limitations of the column and your instrument to avoid damaging equipment.
-
Gradient Program
The Pro EZLC Gradient Program uses a default target resolution value of 1.50, which users can change to match their specific needs. If the target resolution value is not met for all isobaric compounds, the modeller displays a warning symbol ( ) next to the Target Resolution field.
While an initial gradient is automatically supplied by the software, it can be modified either by using the Optimize Gradient Slope button or by making changes manually. To add gradients, change the value in the # of Gradient Steps field to a value from 1 to 3. The modeller will automatically insert the new steps, assigning values that maintain the original gradient program’s slope. The steps can then be adjusted to change the slope of the gradient profile. In addition to the gradient steps, holds can be added at the beginning and '> of the slope. A final re-equilibration can also be added to aid in resetting the system for the next run but, while it may be necessary for in-lab analysis, it is not required for modeling. Note that the chromatogram simulator automatically updates values as changes are made to the gradient program. When producing gradients, the software is designed to, first, attempt to meet the target resolution value for the closest eluting isobars and, second, provide the fastest run time possible with the fewest isobaric coelutions.
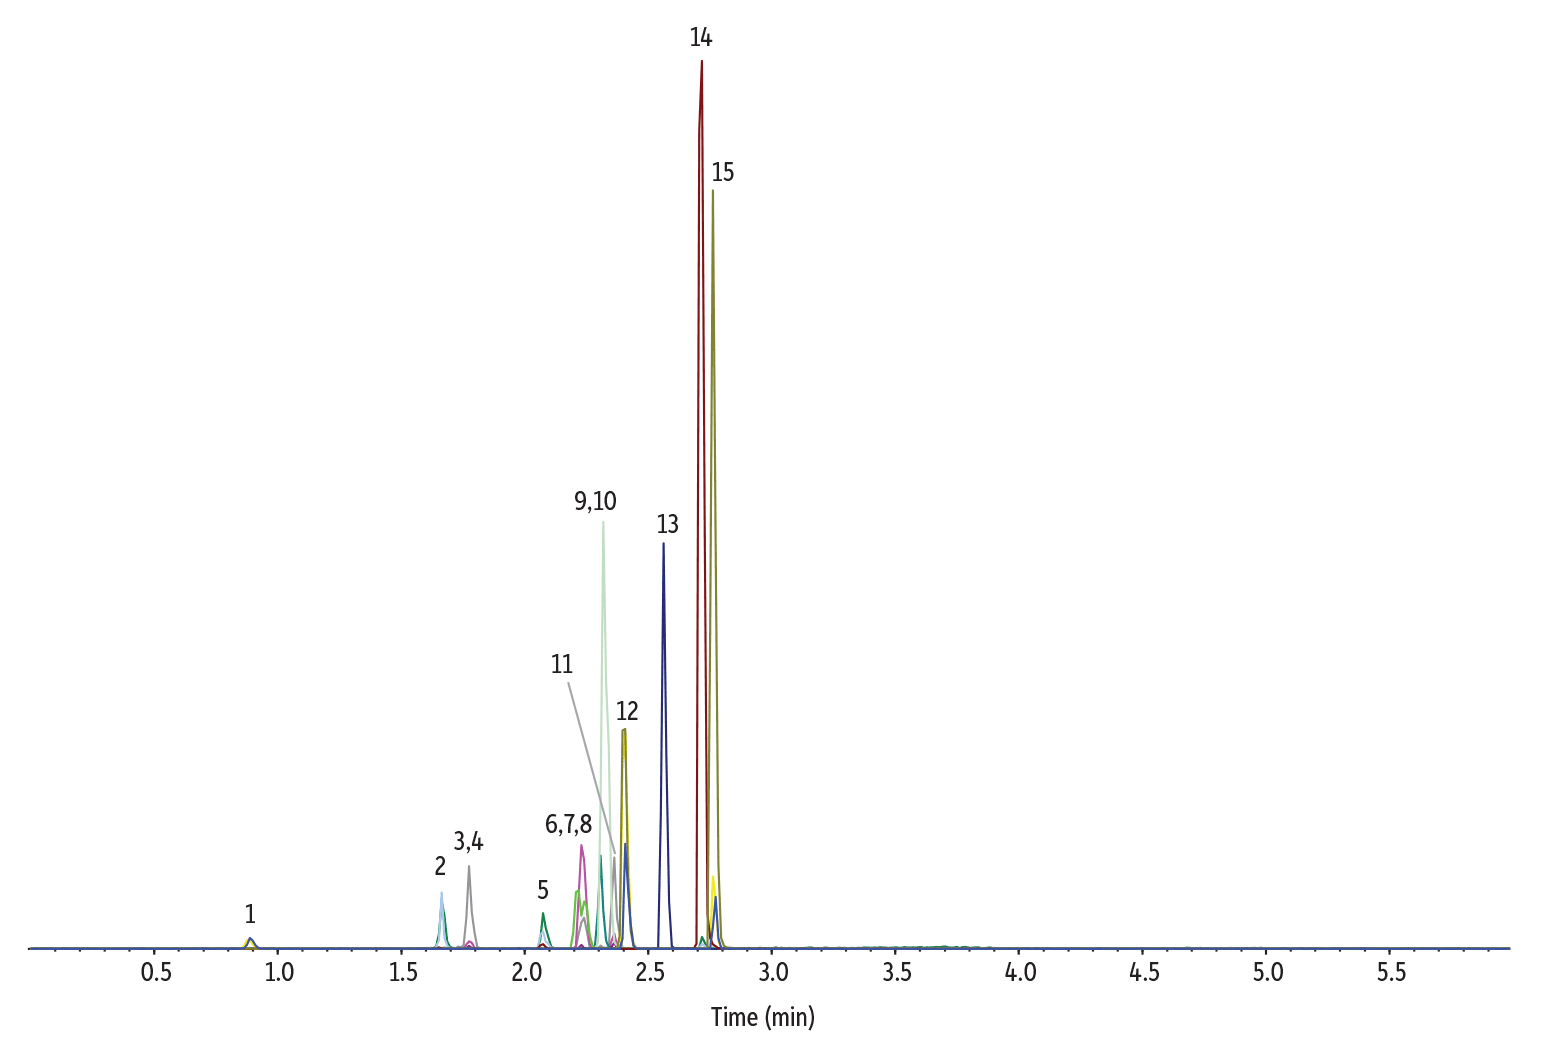
Returning to our drugs of abuse example, we decided to optimize the initial model to reduce the runtime. In order to speed up analysis, we changed the organic mobile phase to acetonitrile, added an isocratic hold to the start of the run, added two gradient steps, modified the %B values, and increased the flow rate. As noted earlier, the dwell volume was already changed to 0.38 mL to match the specific instrument we will use in the lab. Based on the modeled results in Figure 8, our user-optimized method is much faster (3 minutes) than the initial method (7.4 minutes). While completing the analysis in less than half the time provides a significant increase in sample throughput, there is a cost in terms of resolution, particularly for phentermine and methamphetamine which are again predicted to coelute.
Figure 8: User-optimized Pro EZLC model speeds up the analysis of 15 drugs of abuse on a Restek Biphenyl column.

In our final test, we took the speed-optimized model conditions to the lab to evaluate the accuracy of the chromatogram simulator (Figure 9). Again, the Pro EZLC software correctly predicted elution order and closely predicted retention times. In this case, phentermine and methamphetamine were predicted to coelute, and they did in the actual lab analysis. Because phentermine and methamphetamine are isobaric compounds that also share the same product ion, the MS will not be able to distinguish them, and users must determine for themselves if speed or resolution of these particular compounds is most important.
Figure 9: Lab-generated chromatographic results closely match the speed-optimized Pro EZLC model.
| Peaks | tR (min) | Precursor Ion | Product Ion | |
|---|---|---|---|---|
| 1. | Normorphine | 0.89 | 272.3 | 165.2 |
| 2. | Morphine | 1.67 | 286.2 | 152.1 |
| 3. | Oxymorphone | 1.77 | 302.1 | 227.2 |
| 4. | Morphine-N-oxide | 1.78 | 302.3 | 285.2 |
| 5. | Norcodeine | 2.07 | 286.1 | 151.9 |
| 6. | Phentermine | 2.21 | 150.3 | 91.1 |
| 7. | Methamphetamine | 2.21 | 150.3 | 91.1 |
| Peaks | tR (min) | Precursor Ion | Product Ion | |
|---|---|---|---|---|
| 8. | Dihydrocodeine | 2.23 | 302.2 | 199.0 |
| 9. | Codeine | 2.31 | 300.2 | 152.0 |
| 10. | O-Desmethyl-cis-tramadol | 2.32 | 250.2 | 58.0 |
| 11. | Noroxycodone | 2.36 | 302.1 | 227.0 |
| 12. | Desomorphine | 2.40 | 272.1 | 152.1 |
| 13. | N-Desmethyltapentadol | 2.56 | 208.1 | 121.2 |
| 14. | Pentazocine | 2.71 | 286.2 | 218.1 |
| 15. | Dextromethorphan | 2.76 | 272.2 | 215.1 |
| Column | Raptor Biphenyl (cat.# 9309A12) | ||||||||||||||||||||||||||||
|---|---|---|---|---|---|---|---|---|---|---|---|---|---|---|---|---|---|---|---|---|---|---|---|---|---|---|---|---|---|
| Dimensions: | 100 mm x 2.1 mm ID | ||||||||||||||||||||||||||||
| Particle Size: | 2.7 µm | ||||||||||||||||||||||||||||
| Pore Size: | 90 Å | ||||||||||||||||||||||||||||
| Temp.: | 30 °C | ||||||||||||||||||||||||||||
| Standard/Sample | |||||||||||||||||||||||||||||
| Diluent: | Water | ||||||||||||||||||||||||||||
| Conc.: | 100 ng/mL | ||||||||||||||||||||||||||||
| Inj. Vol.: | 1 µL | ||||||||||||||||||||||||||||
| Mobile Phase | |||||||||||||||||||||||||||||
| A: | Water, 0.1% formic acid | ||||||||||||||||||||||||||||
| B: | Acetonitrile, 0.1% formic acid | ||||||||||||||||||||||||||||
|
| Detector | MS/MS |
|---|---|
| Ion Source: | Electrospray |
| Ion Mode: | ESI+ |
| Mode: | MRM |
| Instrument | API LC-MS/MS |
Pro EZLC Software Speeds Up and Simplifies Method Development
As shown here, LC-MS/MS method development can be done effectively and more efficiently using a chromatogram simulator. The Pro EZLC chromatogram modeller from Restek — which is free to use and does not require user data — accurately predicts real-life separations in seconds, allowing chromatographic methods to be developed in a fraction of the time compared to traditional, lab-based approaches. Using Pro EZLC software simplifies method development, saves time and money, and allows users to change chromatographic parameters and instantly see the effects. Whether you implement an initial Pro EZLC model directly in the lab or optimize it further for your particular speed and resolution requirements, this powerful tool is the basis for faster, easier method development.
Source: Restek