IRsolution Optional Software

1. PLS Quantitation Program Compatible with IRsolution Version 1.04 or later
Enables analyzing data with respect to regression equation determined by PLS (partial least squares).
The PLS quantitation program offers PLS1 and PLS2 methods and is able to display input values versus calculated values, PRESS values versus PLS factors, loading vectors, score values, and more.
* The PLS quantitation method is widely used as a tool in chemometrics for simultaneously quantitating multiple components, in a manner similar to multilinear regression analysis.
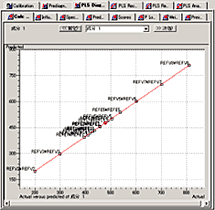
PLS Quantitation Program Window
2. AIM-MAP Mapping Program Compatible with IRsolution Version 1.10 or later
By capturing and synthesizing microscope images from a Shimadzu AIM-8800 Infrared Microscope, this software enables creating visual images of large regions.
The mapping range, measurement interval, background position, and other parameters can be specified directly on the synthesized visual image.
Random (automatically measures multiple pre-registered measurement points), Line, and Area Mapping modes are also available. In addition to general Transmittance and Reflectance Mapping modes, an ATR Microscope Mapping mode is also available (ATR objective lens is optional).
From mapping data, spectra can be extracted and maps of functional groups for specific peaks can be calculated. Data can be displayed 3-dimensionally (birds eye view), using contour lines, or overlaid on spectra.
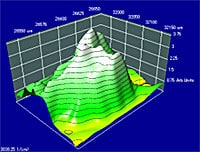
Area Mapping Measurement Example (area mapping of flux on a circuit board)
3. Peak Separation Program Compatible with IRsolution Version 1.04 or later
Normally the absorption band of infrared spectra comprise several overlapping peaks. However, using the peak separation program enables separating the absorption band into individual peaks.
This allows confirming the separation of peaks with hydrogen bonds and functional group peaks obscured by the absorption band.
Six types of waveform modes are available, such Gaussian, Lorentzian, and Gaussian plus Lorentzian modes. This allows selecting the waveform best suited to the given peak shapes in the absorption band. In addition to displaying individually separated peaks, it also can display spectra synthesized from those peaks, which allows confirming the precision of peak separation.
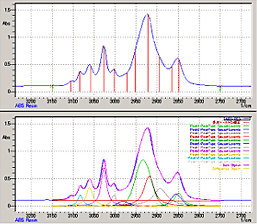
Separation between peaks in 3150 to 2750 cm-1 range of ABS plastic. (The window shown above is for setting peak count, calculation range, and other parameters and the window below is used after peak processing.
4. Macro Platform Compatible with IRsolution Version 1.10 or later
Operating procedures for setting measurement parameters, measuring samples, processing data, saving data, printing, and other operations can be registered as macro programs.
This is a convenient feature, since repetitive routine tasks can be automated. Furthermore, it can be combined with an auto sample changer (optional) or other equipment to create an automated measurement system.
Macro programs are programmed by Shimadzu.