Fluorescence

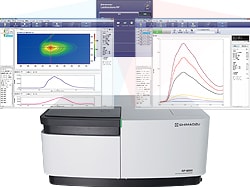
Incorporating technology cultivated over decades of developing fluorescence spectrometers, Shimadzu's versatile RF-6000 fluorescence spectrophotometer maximizes the capabilities of fluorescence spectroscopy with high-speed 3D measurements, ultrafast scanning, outstanding sensitivity, and more uptime. When combined with intuitive software, the RF-6000 spectrofluorometer is ideal for a wide range of applications, from routine analysis to research and development, in such areas as pharmaceuticals, food science, environmental monitoring, and chemicals.
![]()
The RF-6000 fluorescence spectrophotometer offers an extended wavelength and outstanding sensitivity, in addition to a wealth of available accessories, to make it a perfect instrument for both traditional and research applications. In addition to conventional excitation-emission analysis, multiple spectral techniques are available for a variety of applications, such as bioluminescence, chemiluminescence and electro-luminescence. Furthermore, high-speed 3D scanning allows obtaining fluorescence excitation-emission measurements (FEEM) for rapid and accurate differentiation of very similar species. Fluorescence quantum yield and fluorescence quantum efficiency measurements (using the integrating sphere) are also available, along with the capability to analyze liquids, gels, solids, films and powder samples.
With the user’s concern in mind and incorporating years of innovation, the RF-6000 was developed to provide high sensitivity, stability, speed and reliability. It boasts the highest S/N in its class, a scanning speed of up to 60,000 nm/min, 2,000-hr long-life Xe lamp and an extended range PMT detector to scan the wavelength range up to 900 nm. Additionally, the built-in spectral-correction function of the RF-6000 yields ready-to-use accurate data without the need for cumbersome spectral-correction procedures. With all the advanced features, the RF-6000 is suitable for a wide variety of fields, including pharmaceuticals, chemicals, life science, food, environmental and electrical/electronics.
In addition, with the included advanced LabSolutions RF control software, users can get the most out of the instrument in terms of data acquisition, analysis, data integrity and user administration. With the proper software compliance package, the RF-6000 and the software setup can provide total data integrity, user administration and audit trails to fully comply with FDA 21 CFR Part 11 compliance.
RF-6000 Features
- In addition to traditional excitation-emission analysis, multiple other analyses are available, such as bioluminescence, chemiluminescence and electro-luminescence
- Fluorescence Excitation-Emission Matrix (FEEM) and Synchronous Scanning for differentiating between very similar species
- High-speed scanning, up to 60,0000 nm/min, for very quick data acquisition
- Quantum Yield and Quantum Efficiency
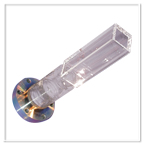
- 2,000-hr long-life Xe lamp and Extended range PMT detector to scan the wavelength range up to 900 nm
- Built-in spectral-correction function
- Suitable for a wide variety of fields, including pharmaceuticals, chemicals, life science, food, environmental and electrical/electronics
- Multitude of accessories available for analyzing liquids, gels, solids, films and powder samples. Accessories include a temperature-controlled cuvette holder, integrating sphere, solid sample holder, autosamplers, microsample holders and polarizers
- Advanced Regulatory Compliance
- GLP/GMP, FDA 21 CFR Part 11 and other regulations with the appropriate software package
- Full support for Pharmacopeia (JP, USP and EP). Validation programs are included for users to periodically measure and record the integrity of measurements
- Enhanced security functions to provide audit trails and various user authority levels (“Administrator”, “Developer” and “Operator”)
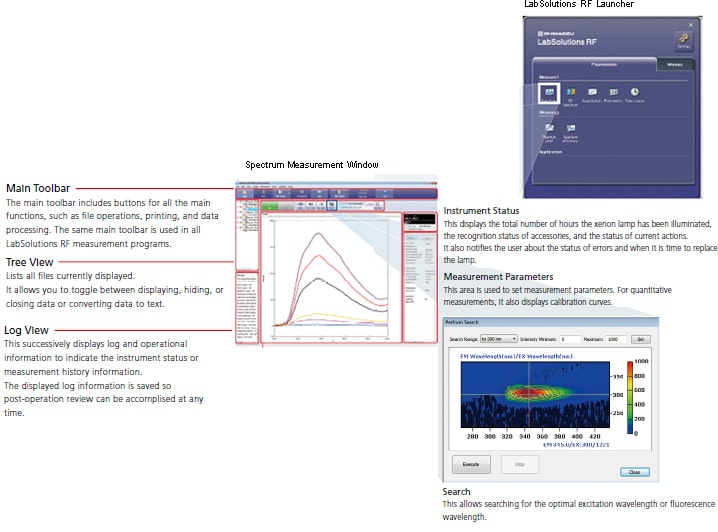
LabSolutions RF Software
 LabSolutions RF software was developed to be easy for anyone to understand and operate. From measurement to analysis, printing, and saving processes, windows are laid out in an easy-to-understand manner, which ensures that measurements can be performed easily.
All measurement programs feature the same main toolbar, menu, measurement toolbar, tree view, and log window conguration, so that each program can be operated in the same manner. This means the same operations can be used to operate all the specialized fluorescence analysis programs.
- Complies with ER/ES regulations including FDA 21 CFR Part 11 and PIC/S GMP
- Centralized management of valuable data of Spectrophotometers (UV, FTIR, RF and EDX), as well as LC and GC data, on a networked server allows simple control over security and backups
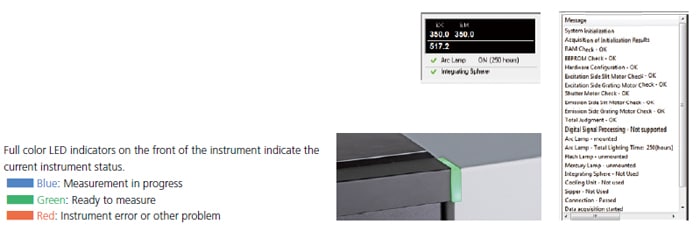
Quantitative Analysis, Creating and Printing Reports, Fluorescence Quantum Yield and Fluorescence Quantum Efficiency, Validation and LED Indicators, Video
All functions can be launched from the LabSolutions RF launcher.
Relevant functions for each measurement action, such as spectral measurements and quantitative measurements, are organized conveniently on the LabSolutions RF launcher. That allows easy selection of the desired measurement function. In addition, frequently used Windows applications can also be added to the LabSolutions RF launcher.
* Please contact Shimadzu representative to comply with ER/ES regulations including FDA 21 CFR Part 11 and PIC/S.
Spectral Correction
Spectral correction functions are included standard, which allows you to display spectra corrected in real time!
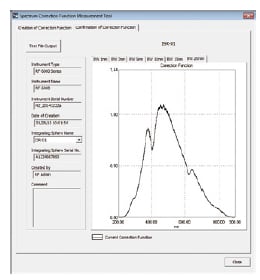
A spectral correction function for obtaining the true excitation and fluorescence spectra determined by correcting the instrument function for instrument characteristics, such as the emission characteristics of the light source and spectral characteristics of the optical system, is included standard. Because true spectra can be obtained in real time, the spectra can be easily compared to spectra measured using other instruments. The spectral correction functions preregistered in systems are determined using a calibrated standard light source and Shimadzu's proprietary correction techniques. If an integrating sphere is installed as an accessory, a function for creating spectral correction functions is included standard; this eliminates the need to install a special light source.
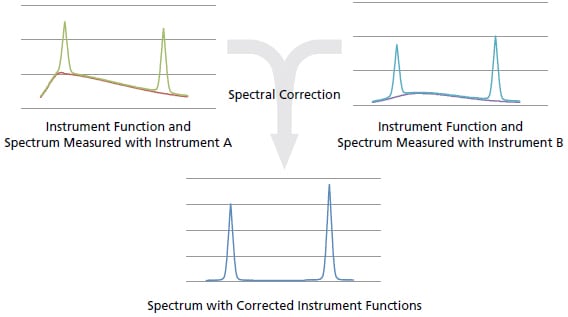
Overview of spectral correction
A certain sample had two fluorescence peaks. When that sample was measured using instruments A and B, the fluorescence peak intensity was higher for the left peak with instrument A, whereas the right peak was higher for instrument B. In reality, the spectral peak intensities and positions differed because instruments A and B each had the emission characteristics of light source and the spectral characteristics of optical system. Correcting the spectra by subtracting the difference in light source and optical system characteristics resulted in the same spectra, which reveals that the two peaks are successively larger as the wavelength increases. By comparing the spectra measured with different instruments the effects from differences in instrument characteristics cannot be ignored. Spectral correction allows you to compare data measured using different instruments.
3D Measurements
3D spectra can be measured at high speed.
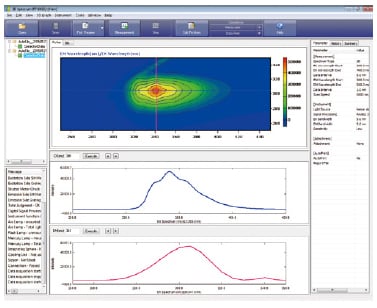
Excitation wavelength versus fluorescence wavelength 3D fluorescence spectra can be obtained by successively varying the excitation wavelength as fluorescence spectra are measured. 3D fluorescence spectra are helpful for determining the optimal excitation wavelength and fluorescence wavelength. Recently, differences in such 3D fluorescence spectral patterns (shapes) have allowed for discriminating between different types of samples or identifying the source of samples in some cases. Because the RF-6000 is able to scan samples at high speeds up to 60,000 nm/min, 3D fluorescence spectra can be obtained quickly, even for 3D measurements of the maximum wavelength range.
Quantitative Analysis
High-sensitivity quantitative measurements can be performed easily.
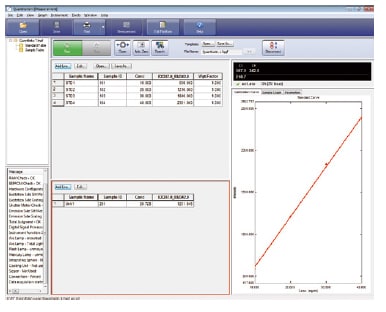
Calibration curves are prepared from fluorescence spectra of samples with known concentrations, based on peak intensity and peak area values.
As a result, the concentration of samples without known concentrations can be calculated from the fluorescence spectral results based on the calibration curve that was created. These calculated concentration values can then be used in various formulas to perform additional calculations. They can also be used for pass/fail decisions based on a speciˆed threshold value.The system supports performance validation in accordance with procedures specified in JIS K 0120 General rules for fluorometric analysis. Note: An optional mercury lamp is required for conrming wavelength accuracy, resolution, and wavelength repeatability.
Creating and Printing Reports
Report formats can be created easily.
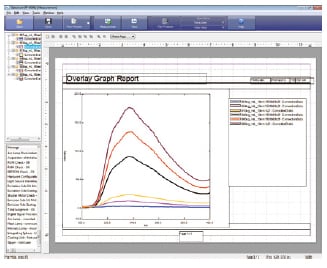
Printed reports can be freely prepared by simply dragging the desired content to the desired layout. This allows you reviewing the layout before printing, with content dragged into place, without using the print preview function.
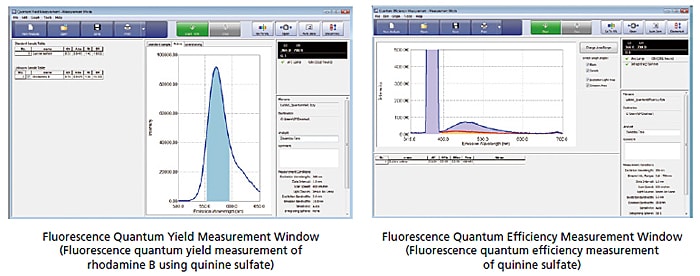
Fluorescence Quantum Yield and Fluorescence Quantum Efficiency
Measuring fluorescence quantum yield and fluorescence quantum efficiency is simple.
The fluorescence quantum yield can be calculated by comparing the fluorescence spectra of unknown samples with those of a standard sample with a known quantum yield. The 100 mm diameter integrating sphere unit can also be used to calculate the fluorescence quantum efficiency. The user-friendly window design allows anyone to easily measure the fluorescence quantum yield and fluorescence quantum efficiency using intuitive operations.
Validation and LED Indicators
Validation function allows you to diagnose performance. The system supports performance validation in accordance with procedures specified in JIS K 0120 General rules for fluorometric analysis. Note: An optional mercury lamp is required for conrming wavelength accuracy, resolution, and wavelength repeatability.